12Introduction to Python for Medical Students
A Practical Primer
10/30/23
Objectives
Download and install Python 3 on your computer
Be able to take input data and generate output results using Python
Be able to import modules libraries and load data
Know what an array and dataframe are
Understand what a function is and how common functions work
Learn data wrangling basics
Installing Python
Download Python at python.org/downloads
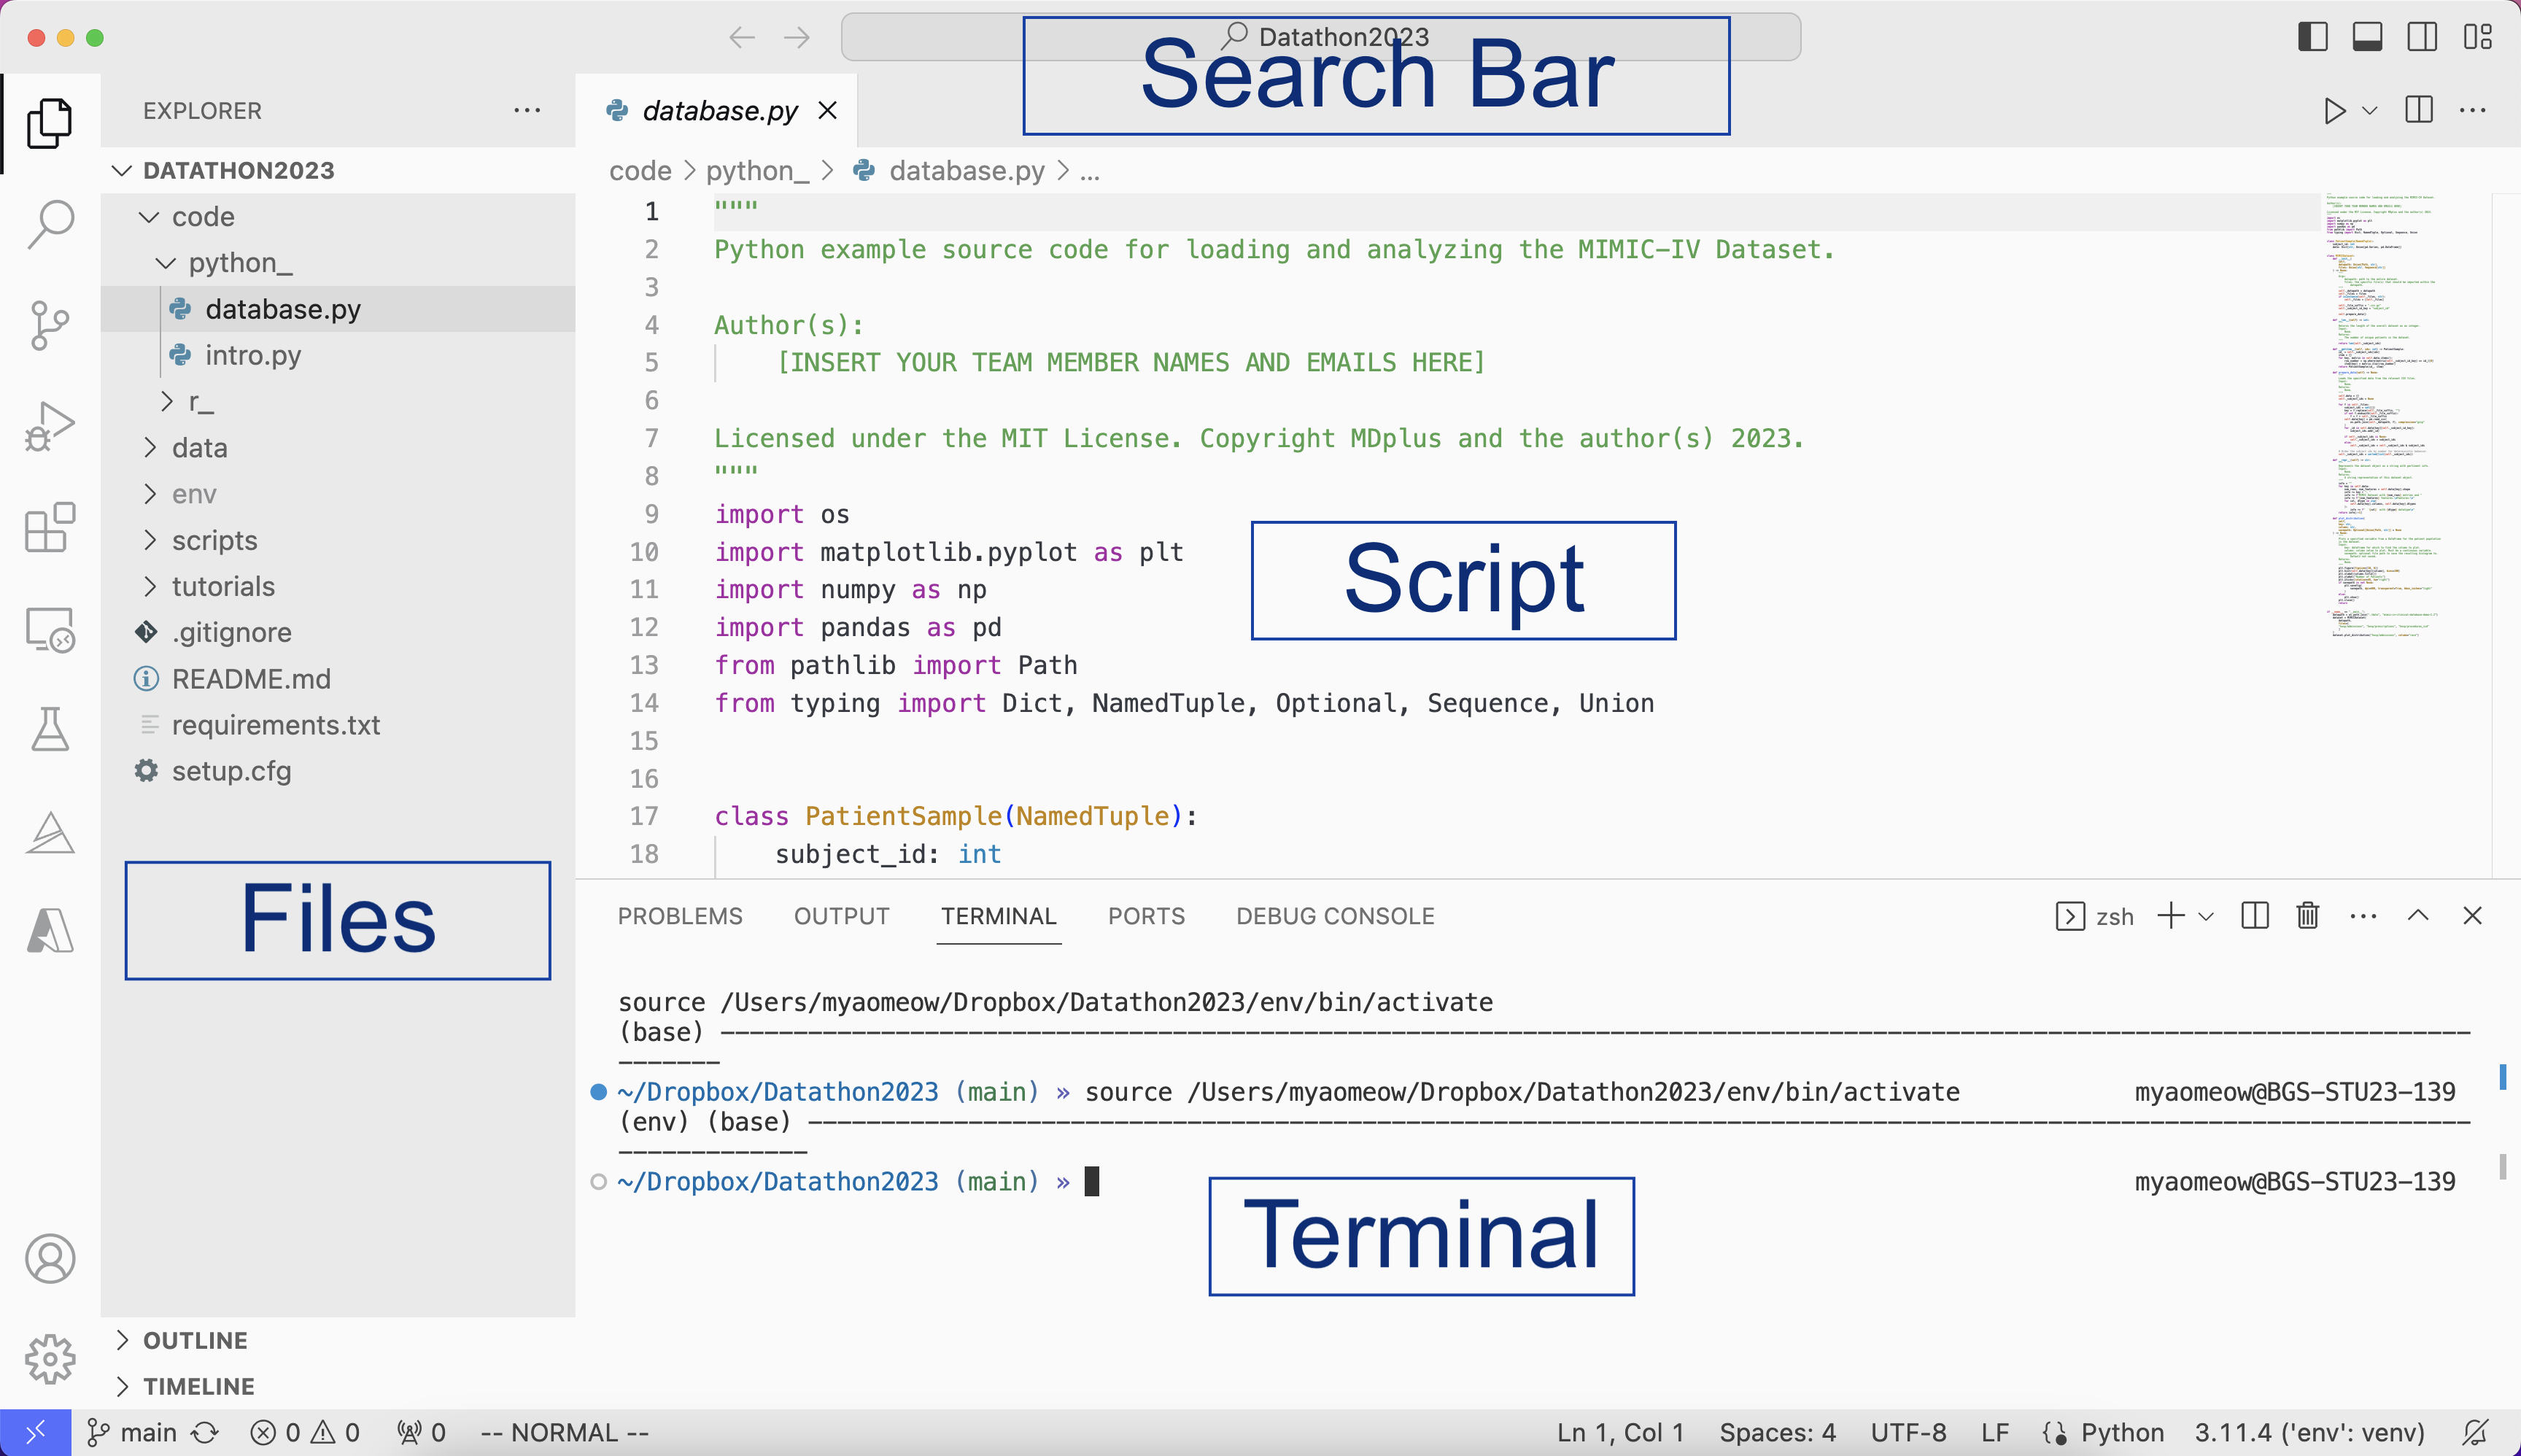
Download Visual Studio Code at code.visualstudio.com/download
Visual Studio Code (VS Code) is an Integrated Development Environment (IDE), which provides a visual and interactive interface to make coding in Python easier
Python is the programming language that we can use to explore datasets
Visual Studio Code (VS Code)

Packages
The power of Python is being open source
pip install package_nameinstalls a package for the first time (only need to do once)For this session, go to the terminal and run
pip install numpy⏎andpip install pandas⏎in your consoleimport numpy as npandimport pandas as pdloads these packages into your.pyprogram
High Yield Basic Concepts
Assignment: assign a value to a variable name (e.g.
x = 10)- Note: your name shouldn’t have spaces. Instead use
snake_caseorcamelCase Functions: your “action verbs”, which take in input argument and return output (e.g.
mean())Comments: helpful statements to help you and others better understand your code, but are not executed. (e.g.
# This is a comment!)
A Little More About Functions
This is how to write your own function:
syntax:
def function_name(arguments):arguments: what you pass in as inputs
Arrays
Basic data structure in Python
Function
np.array()converts alistinto an arrayIndexing
[]retrieves elements of a vector by position (or by name for a named vector)
Useful Vector Functions
len(): returns the number of elements in the arraynp.mean(): mean of elements in vector
Be careful with
NaNvalues
DataFrame's
Tidy data principles
Each row is an observation
Each column is a variable
Each cell contains one value
How do data frames relate to vectors?
- Imagine a data frame as a bunch of vertical vectors next to each other
pd.DataFramecreates a data frame
Importing Data as DataFrame's
Exploring Your Data
Use
print(my_data.columns)to print out the features in your dataset.Use
print(my_data)to view the size of the dataset and some example rows.Use the
matplotliblibrary to plot data of interest. Tutorial
Accessing your Data
Use the
[]operator to select specific columns
  Sepal.Length Sepal.Width Petal.Length Petal.Width Factor
        1          5.1         3.5          1.4      0.2
        2          4.9         3.0          1.4      0.7
        3          4.7         3.2          1.3      1.3
        4          4.6         3.1          1.5      1.0
        5          5.0         3.6          1.4      0.9
        6          5.4         3.9          1.7      0.4
0.2 0.7 1.3 1.0 0.9 0.4My code's not working...
Google and StackOverflow are your best friends
When asking a question online, make sure your code is as simple as possible. Only include the minimum required lines
ChatGPT may be helpful
Stop by Office Hours and ask for help!
Acknowledgements
Many thanks to Lathan Liou for providing the template for this presentation!
