[1] 4Introduction to R for Medical Students
A Practical Primer
11/02/23
Getting R and RStudio
Download RStudio here
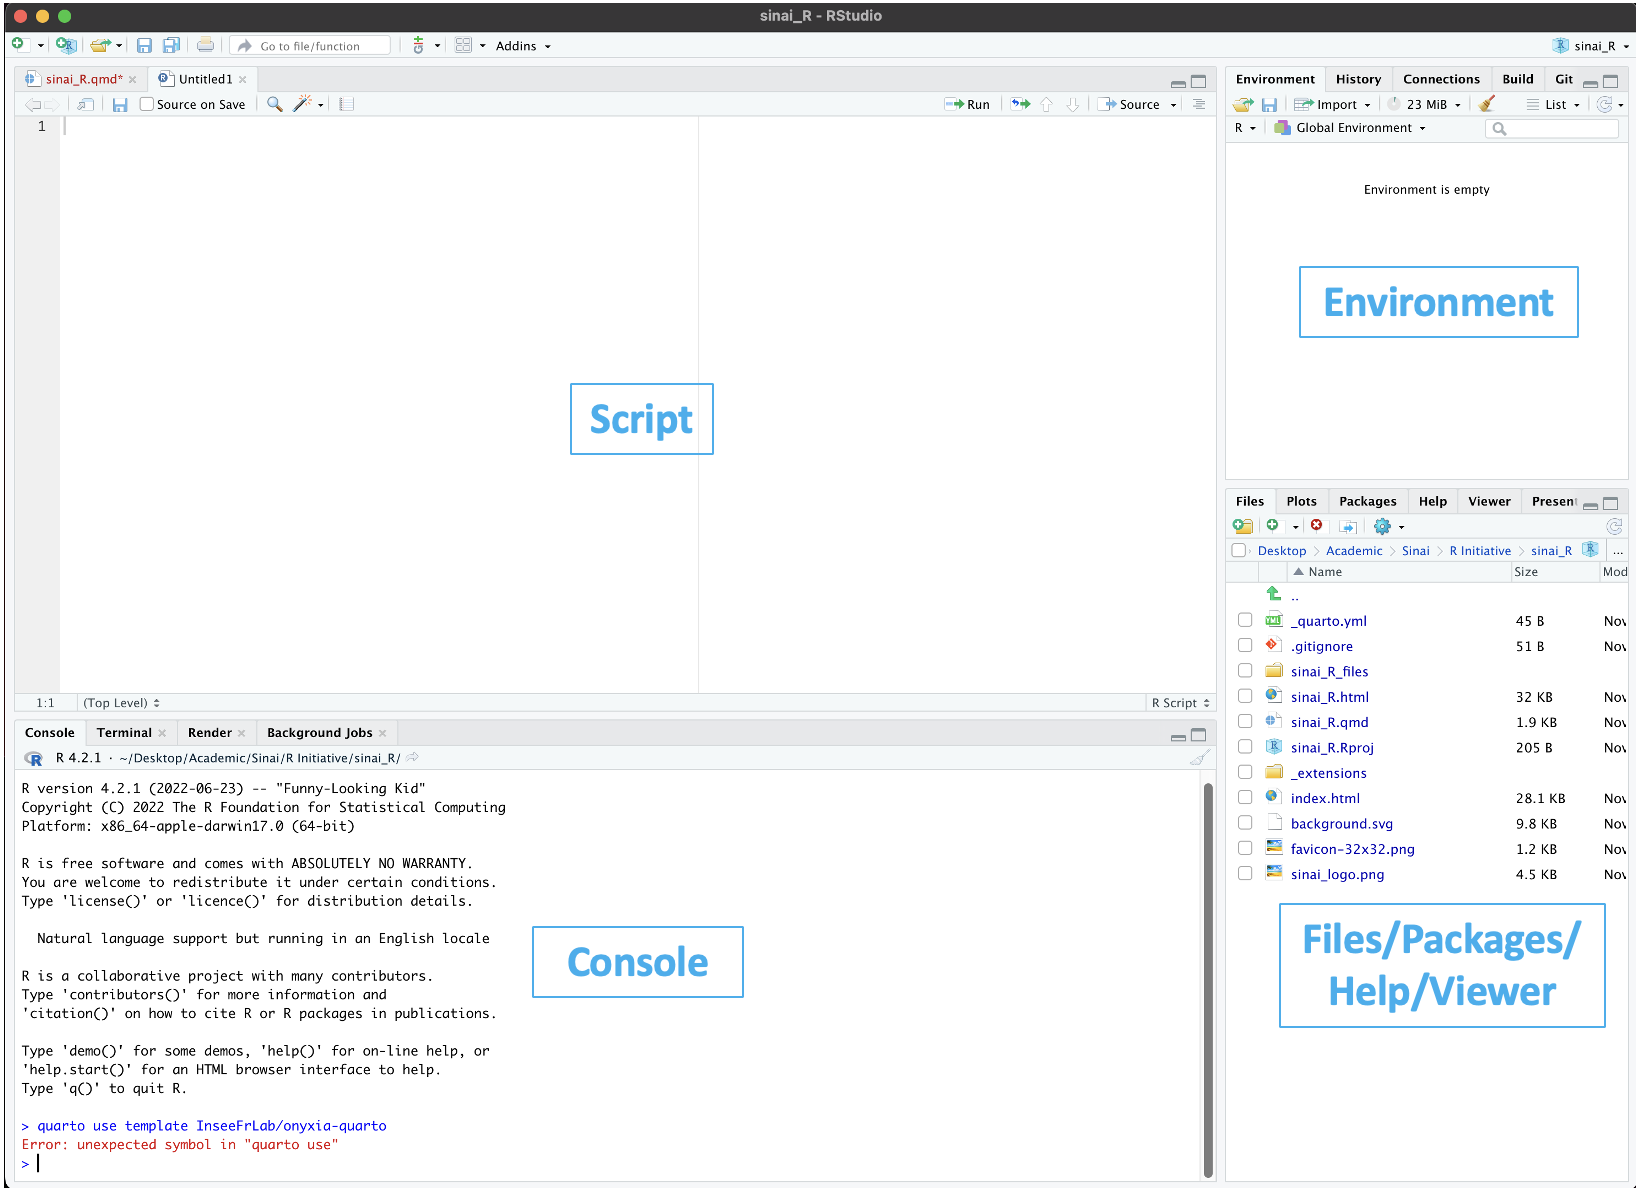
RStudio is an Integrated Development Environment (IDE), which provides a visual and interactive interface to make coding in R easier
R is the language maintained by volunteers whereas RStudio is a product maintained by a company called Posit
RStudio
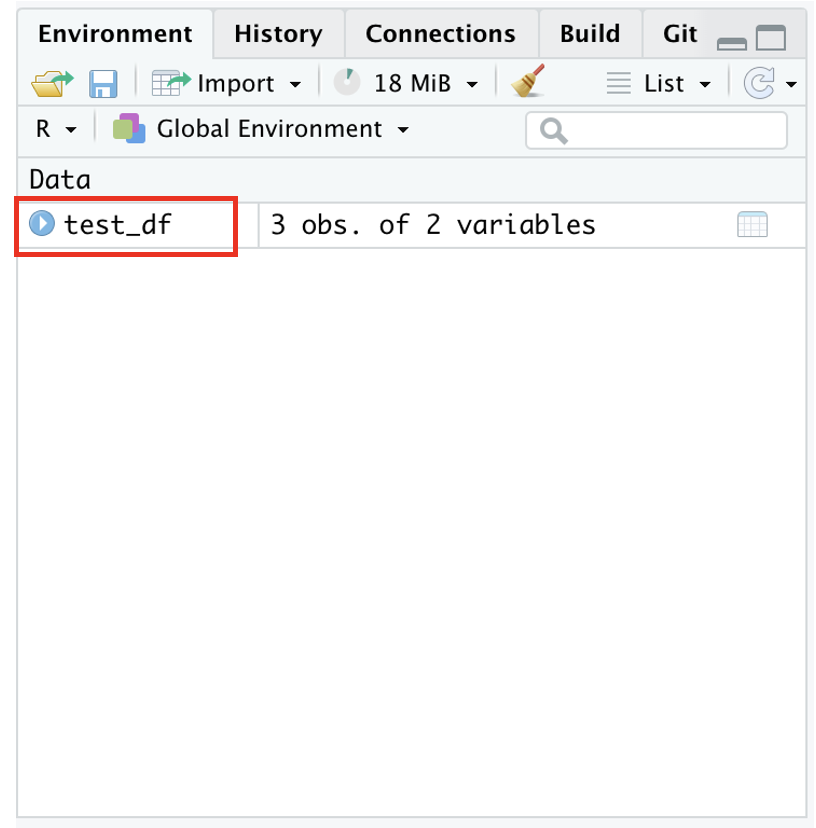
Viewing your Data
Either click the object in the Environment panel
![]()
Or use the
View()function (it’s cleaner to type this into your console)Use
str()to understand data types (numeric, character, date, etc.) in your dataUse
names()to view row names andcolnames()to view column names of a dataframe
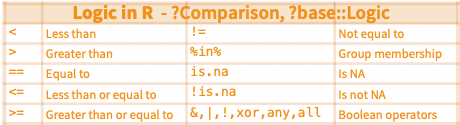
Data Wrangling Verbs You Should Know
Disclaimer: A lot of functions will be introduced in the next couple of slides, so please bear with me. We will practice these afterwards and you can always refer to the cheatsheet referenced in the last slide.
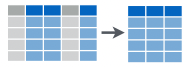
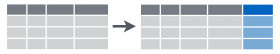
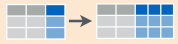
select(): select variables you want to keep![]()
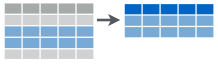
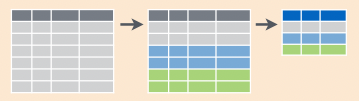
filter(): select rows you want to keep based on condition(s)![]()
![]()
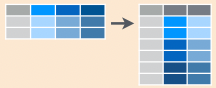
mutate(): create or modify variables![]()
More Data Wrangling Verbs You Should Know
summarize(): compute summary statistics into a single row![]()
count(): tabulate counts for each level of variablegroup_by(): useful in conjuction with `summarize()` and `count()`.
Even More Data Wrangling Verbs You Should Know
pivot_longer(): useful in conjuction with `summarize()` and `count()`![]()
separate(): useful in conjuction with `summarize()` and `count()`![]()
%>%: pipe function
Joining Dataframes
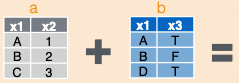
left_join(a, b, by = "x1")![]()
inner_join(a, b, by = "x1")![]()
semi_join(a, b, by = "x1")![]()
- NB: You can join by multiple keys


